
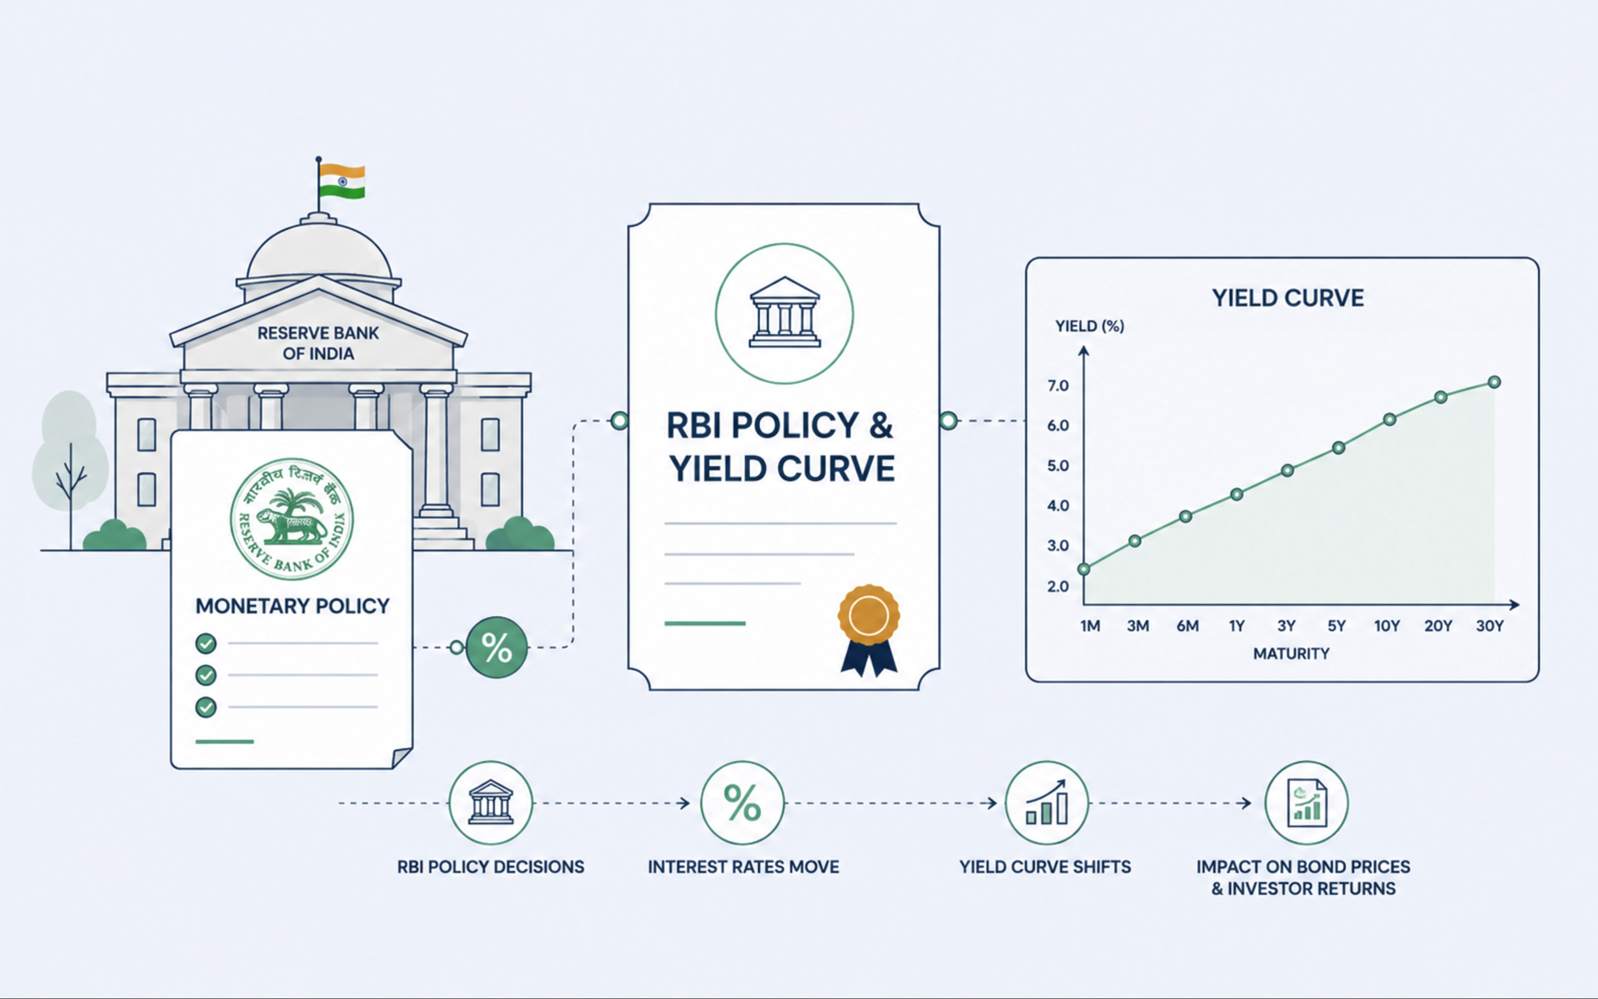
from an RBI committee’s decision to the price of the bond in your portfolio, and shows how experienced investors use the yield curve as a forward-looking instrument rather than a chart to admire.
RBI Policy, the Yield Curve & What Moves Bond Prices
At the beginner level, a bond’s price is a matter of one issuer’s promise. At the intermediate level, it’s a seesaw against interest rates. At the advanced level, you have to ask the deeper question: what makes the whole level of interest rates move in the first place?
The answer is a tug-of-war between the central bank, inflation, growth, and government borrowing - and the scoreboard for that contest is the yield curve. Learn to read it, and you stop reacting to bond prices and start anticipating them.
This article traces the full causal chain, from an RBI committee’s decision to the price of the bond in your portfolio, and shows how experienced investors use the yield curve as a forward-looking instrument rather than a chart to admire.
The starting point: what the RBI actually controls
The Reserve Bank of India sets monetary policy through its Monetary Policy Committee (MPC), which meets periodically to decide the repo rate - the rate at which the RBI lends short-term funds to banks. As of mid-2026, that rate sits at 5.25%, following a cut in December 2025, with the MPC holding it there and maintaining a neutral stance under Governor Sanjay Malhotra. (These are current facts that change with each policy cycle; the reasoning below outlives any single number.)
The critical thing to understand is what the repo rate does and doesn’t control. The RBI directly influences the very short end of the interest rate spectrum - overnight and near-term money. It does not directly set the rate on a 10-year government bond. That longer rate is decided by the market, based on what investors expect to happen over the coming decade.
This distinction is the master key to yield-curve analysis. Short rates are anchored by policy; long rates are anchored by expectations. Everything interesting happens in the tension between the two.
The RBI’s mandate frames the whole exercise. It operates under flexible inflation targeting: a mandate to keep consumer price inflation around a central target, within a tolerance band, while supporting growth. When inflation threatens to run hot, the RBI leans toward raising rates and draining liquidity; when growth falters and inflation is tame, it leans toward cutting. The repo rate is its loudest instrument, but not its only one - it also uses the cash reserve ratio, the standing facilities that form a corridor around the repo rate, and open market operations (buying or selling government bonds outright) to steer liquidity.
The transmission chain: from Mumbai to your portfolio
Here’s how an RBI decision travels to the price of a bond you hold. Follow the dominoes.
The MPC changes the repo rate (or signals a future change through its stance and commentary).
Banks’ funding costs shift, so the rates on new deposits, loans, and short-term instruments adjust.
New bonds get issued at the new prevailing rates. If the RBI cut rates, fresh bonds carry lower coupons; if it hiked, higher coupons.
Existing bonds re-price on the seesaw. A rate cut makes your older, higher-coupon bonds more valuable (prices up); a hike does the reverse.
The whole yield curve shifts and reshapes, because the market simultaneously updates its expectations for growth, inflation, and future policy.
Notice step 5. A policy move doesn’t just nudge one point - it forces the market to re-examine its entire forecast for the future. That’s why a single 0.25% repo change can move long-dated bonds by more or less than the change itself, depending on what the market reads into it. What the RBI signals about the future often matters more than what it does today. A rate cut delivered alongside hawkish commentary can actually push long yields up, because the market concludes the easing cycle is ending.
The yield curve: the market’s forecast, drawn as a line
A yield curve plots the yields of government bonds against their time to maturity - 3-month, 1-year, 2-year, 5-year, 10-year, 30-year - connected into a single line. Because government bonds are (near) default-free, this curve strips out credit risk and shows you the pure price of time and expectations.
It typically takes one of three shapes, and each tells a story.
1. Normal (upward-sloping). Longer bonds yield more than shorter ones. This is the usual state of affairs and reflects two things: investors demand extra compensation (a term premium) for locking money away longer and bearing more uncertainty, and it often signals expectations of healthy growth and stable-to-rising inflation ahead.
2. Flat. Short and long yields converge. This tends to appear at turning points - when the market is unsure whether the next move is toward slowdown or acceleration, or when a rate-hiking cycle is maturing. A flattening curve is often the market whispering that the easy part of the cycle is over.
3. Inverted (downward-sloping). Short yields exceed long yields - an unusual, attention-grabbing shape. It usually means the market expects rates to fall in the future, which typically happens when investors anticipate an economic slowdown that will force the central bank to cut. In many economies, a deeply inverted curve has historically preceded slowdowns, though it’s a signal, not a guarantee, and its reliability varies by country and era.
Here’s how to read the two ends independently, which is where real analytical skill lies:
Part of the curve | Mainly driven by | What moves it |
|---|---|---|
Short end (up to ~1–2 years) | RBI policy | Repo rate and near-term rate expectations |
Belly (2–7 years) | A blend | Policy path plus medium-term growth/inflation views |
Long end (10 years+) | Expectations & supply | Long-run inflation, growth, term premium, government borrowing |
When the RBI cuts rates, the short end usually drops promptly. The long end may or may not follow - it depends on whether the market believes the cut will tame the economy or stoke future inflation. This is why the shape of the curve, not just its level, carries information.
What actually moves the long end
Since the long end isn’t set by the RBI, what sets it? Four forces, in constant negotiation.
1. Inflation expectations. This is the heavyweight. A lender committing money for ten years must be compensated for the erosion of purchasing power over that decade. If the market expects higher future inflation, long yields rise to protect real returns; if inflation expectations anchor low, long yields can stay contained even when short rates are elevated. Every serious bond investor watches inflation data and expectations more closely than almost anything else.
2. Growth expectations. Strong expected growth tends to lift long yields (more demand for capital, more inflation pressure, less need for the central bank to keep rates low). Weak growth expectations pull them down.
3. Government borrowing (fiscal supply). Bonds obey supply and demand like anything else. When the government runs large deficits and floods the market with new issuance, the increased supply can push yields up - buyers demand a better price to absorb the extra paper. India’s fiscal position and its annual borrowing programme are therefore direct inputs into long-end yields. This is a genuinely underappreciated driver: sometimes yields rise not because of inflation or the RBI, but simply because there are more bonds to sell than natural buyers at the current price.
4. Global forces and flows. Indian yields don’t exist in isolation. Global interest rates (especially US Treasury yields), the rupee’s strength, crude oil prices (which feed Indian inflation directly), and foreign investor flows into and out of Indian debt all tug at the long end. When global rates rise or the rupee weakens, foreign capital can leave Indian bonds, pushing yields up. The inclusion of Indian government bonds in global bond indices has increased this two-way sensitivity - more foreign money in means more foreign money that can move.
Putting it together: reading the cycle
Advanced investors don’t watch these forces in isolation; they read them as a cycle. A simplified map of how the phases tend to interact:
Phase | Typical conditions | RBI tendency | Curve behaviour | Bond implication |
|---|---|---|---|---|
Slowdown / easing | Weak growth, cooling inflation | Cutting rates | Short end falls, curve steepens | Longer-duration bonds gain most |
Recovery | Growth picking up, inflation stirring | Holding, then leaning to hike | Curve flattens as long end rises | Shorten duration; caution on long bonds |
Overheating / tightening | Strong growth, rising inflation | Hiking rates | Short end rises, curve flattens/inverts | Short bonds and floating exposure favoured |
Peak / turning | Inflation contained, growth wobbling | Hold, signal cuts | Curve steepens again | Prepare to extend duration |
(This is a stylised framework, not a prediction. Real cycles are messier, overlap, and are frequently disrupted by shocks - a war, an oil spike, a global financial event. The value is in having a mental map, not a mechanical rule.)
The single most actionable idea here: duration positioning should follow the cycle. When you expect the RBI to cut and the curve to steepen (an easing phase), lengthening duration lets you capture price gains. When you expect hikes and a flattening curve, shortening duration protects you. This is how the yield-curve reading connects directly to the duration and laddering tools from the intermediate level.
A worked example of the logic
Let’s reason through a hypothetical, clearly illustrative scenario to show the analysis in motion - not a forecast, just a demonstration of how the pieces click together.
Suppose inflation has been falling steadily, growth is soft, and the RBI has just cut the repo rate with dovish commentary hinting at more to come. An informed investor reasons:
The short end will drop further as more cuts get priced in.
The long end may fall too, if the market believes inflation will stay tamed - but if the government simultaneously announces a large borrowing programme, that extra supply could keep the long end sticky even as the short end falls, steepening the curve.
Net read: an easing phase, favouring longer-duration high-quality bonds to capture price appreciation - but with one eye on the fiscal/supply picture, because heavy issuance could blunt long-end gains.
Now flip it. Suppose crude oil spikes, the rupee weakens, and inflation prints come in hot. The same investor reasons the RBI may pause or turn hawkish, long yields could rise on inflation fears and currency pressure, and the prudent move is to shorten duration and avoid getting caught in long bonds. Notice that in this case, the global and currency channels did the damage, not a domestic rate hike - the RBI hadn’t even moved yet. Reading only the repo rate would have missed the risk entirely.
This is the essence of advanced bond investing: not memorising which shape means what, but reasoning through which forces are dominant right now and what they imply for where yields go next.
Common mistakes even experienced investors make
Watching only the repo rate. The repo rate governs the short end. Your long bonds are moved more by inflation expectations, fiscal supply, and global flows. Fixating on RBI announcements while ignoring the borrowing calendar or oil prices is a classic blind spot.
Treating the yield curve as a prophecy. An inverted curve signals market expectations, which are frequently wrong. Use it as one input, not an oracle.
Ignoring the term premium. Long yields aren’t just an average of expected future short rates - they include compensation for uncertainty, which itself fluctuates. When uncertainty rises, long yields can climb even without any change in the expected policy path.
Fighting the fiscal picture. Underestimating how much government borrowing supply can push up long yields, regardless of what the RBI does, has caught out many.
Confusing “the RBI cut rates” with “my long bond will rise.” Sometimes a cut is already fully priced in, and the bond doesn’t budge - or falls if the accompanying message disappoints. Markets move on surprises versus expectations, not on the raw event.
What this means for you
If you invest in bonds beyond a simple hold-to-maturity plan, your returns will be shaped as much by macro forces as by your issuer selection. The disciplined approach is to build a mental model of the cycle - where inflation, growth, fiscal supply, and RBI policy currently sit - and let that model guide your duration decisions, while your laddering and credit quality choices provide ballast against the times your read is wrong.
You won’t call every turn correctly; nobody does, including professionals with far more data. But an investor who understands why yields move is dramatically better positioned than one who simply watches prices swing and wonders what happened.
Key takeaways
The RBI controls the short end of the curve via the repo rate (currently 5.25%, neutral stance as of mid-2026); the market sets the long end based on expectations.
The yield curve is the market’s forecast drawn as a line - normal, flat, or inverted - and its shape carries more information than its level.
Long yields are driven mainly by inflation expectations, growth, government borrowing (fiscal supply), and global/currency forces - not directly by the RBI.
Duration positioning should follow the cycle: extend in easing phases, shorten in tightening phases, and ladder to hedge an uncertain call.
Markets move on surprises versus expectations - what the RBI signals about the future often matters more than the rate change itself.
This is educational content, not personalized investment advice. Ratings can change, and a AAA rating does not eliminate credit risk; it only estimates it as lower.